|
|
||||||||||||||||||||||||||||||||||||||||||||||||||||||||||||||||||||||||||||||||||||||||||||||||||||||
|
September 2003 |
||||||||||||||||||||||||||||||||||||||||||||||||||||||||||||||||||||||||||||||||||||||||||||||||||||||
|
|
|
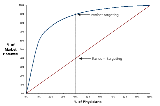
Sales success depends on a sales force’s ability to execute four key activities: · targeting the right customers · calling on them with the right message · calling on them with appropriate frequency, and · implementing effective marketing programs Our April newsletter highlighted targeting strategies and tactics. This month, we describe a simple metric that measures how effectively the sales force executes the customer targeting strategy. The final article in our three-part customer targeting series will describe a process for using the targeting effectiveness metric to improve customer targeting and increase sales. Throughout the product life cycle, sales and marketing teams have one critical responsibility: identifying customers with the highest sales potential. Once marketing defines the high potential customer segments, the sales force must identify and call on the doctors that comprise each segment. Calling on the right customers routinely makes the difference between sales success and failure. In markets where universal prescribing data is not available, it's more difficult for the sales force to easily identify high potential customers, and more difficult for sales force managers to truly evaluate how well sales reps are executing the targeting strategy. The targeting effectiveness, or TE metric was developed as part of a sales effectiveness process to evaluate strategy implementation, improve customer targeting and increase sales. By integrating the TE metric as part of a larger targeting and profiling effort, one top 10 pharmaceutical firm estimated its one-year profit gains at $250 million. What is targeting effectiveness? Targeting effectiveness uses representative physician prescribing data to measure how well a sales force covers a market for any given reach of physicians. The metric considers what percentage of the total market potential a sales force is covering compared to how much it would cover with no targeting effort (picking doctors at random) and how much it could cover if it targeted only the doctors with the highest prescribing potential. The data provides the basis for calculating the TE metric. Sorting (in descending order of potential) all physicians that prescribe in a therapeutic class generates a concentration curve (see figure 1).
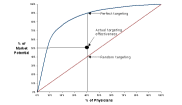
In this example, 40% of prescribing physicians generate 90% of total prescriptions for the product class. That is, with a reach of 40% of relevant physicians, a sales team that called only on the “best” 40% of physicians would cover 90% of the market potential. Consider the opposite case. A sales team chooses doctors at random. One assumes that on average, a sales team with 40% reach would cover only 40% of the market. In figure 1, the 45º line represents random, or no, targeting effort for any given reach. Targeting effectiveness measures actual market coverage as a percentage of the distance between random and perfect targeting. Figure 2 shows a sales team with 20% targeting effectiveness. In other words, the actual value of the market covered by the sales team is 20% of the distance from random targeting to perfect targeting: (Actual market coverage – random market coverage) or
(50% - 40%) = 20% By measuring targeting effectiveness over time, managers can track and manage improvement in targeting strategy execution.
Calculating the metric requires managers to integrate data from different sources. Click here for a short tutorial on the mechanics of data matching. The TE Metric: Three Magic Numbers Once appropriately formatted data is available, the TE metric can be easily calculated by obtaining three values for a sales team’s given reach: · Perfect market coverage · Actual market coverage · Random market coverage In the example in figure 4, targeting effectiveness is (1,393 - 1,109) / (2,499 - 1,109) = 20%. Each of these numbers can also be expressed as a percentage of the total market potential as in the equation at the top of the previous page: (50% - 40%) / (90% - 40%) = 20%. Either way, the targeting effectiveness score is the same.
How should these results be interpreted? A 20% score represents a typical first-time measurement in a non-US market. Due to access restrictions and other unique market factors, the practical upper limit for targeting effectiveness scores is 70% - 80%. By implementing a disciplined physician profiling process and tracking targeting effectiveness scores over time, managers can dramatically improve execution of the targeting strategy to increase market coverage and sales without increasing staff. Depending on a sales team’s product portfolio and targeting strategy, calculating targeting effectiveness may be more involved than the example we've just outlined. For example, a sales team may carry several products to more than one physician specialty. Management may want to study targeting effectiveness separately for each specialty. Defining PotentialPotential may be defined as sales for a single therapeutic class or several classes. Or, it may be defined by an index of multiple criteria that can include: · number of patients · consult fee · number of competitive products prescribed within a class, or · propensity to switch products or classes However potential is defined and indexed, the basic process for calculating the metric remains the same: match sample physician prescribing data to call data and measure actual market coverage relative to random coverage and perfect coverage. The example presented in this article represents the most common approach to defining physician potential and calculating targeting effectiveness. However, there are two cases when this approach is not recommended: 1. in markets where universal prescriber information is available, and 2. for sales teams with greater than 80% reach on relevant physician specialties. In these cases, the targeting effectiveness metric should be modified to address the distribution of the workload among physicians that are visited. The TE metric is an effective tool for measuring sales force implementation of the customer selection strategy. As part of an overall profiling and effort distribution process, it can dramatically improve market coverage and sales. Our next newsletter will describe a process to improve targeting execution in any market. Prior Newsletters To view prior newsletters, please visit our newsletter index at http://www.rmcionline.com/html/news/ Subscribe/Unsubscribe Please click here to unsubscribe from the RMCI newsletter. Copyright Notice Copyright 2003, RM Consulting International. All rights reserved. Every viewer may copy, reprint or forward all or part of this newsletter to friends, colleagues or customers, so long as any use is not for resale or profit and the following copyright notice is included intact: "Copyright 2003, RMCI. All rights reserved." Contact Information RM Consulting International |
|
|
||||||||||||||||||||||||||||||||||||||||||||||||||||||||||||||||||||||||||||||||||||||||||||||||||


